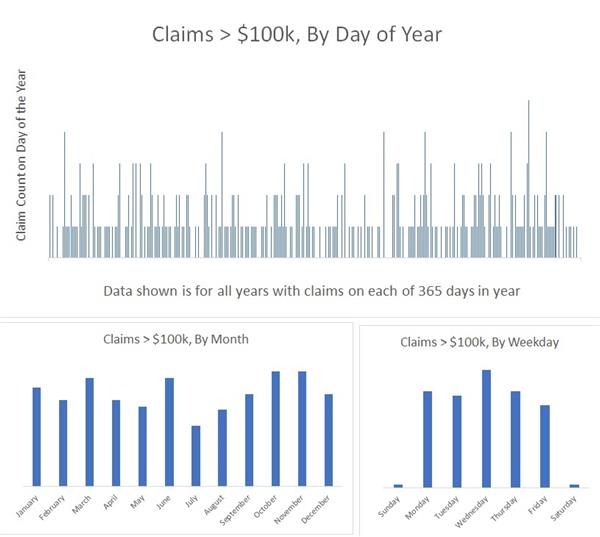
Indeed, what day of the year is the most dangerous for errors & omissions claims? Which month? What day of the week? Wouldn't it be nice to know?
The question came to me from your Big “I” Professional Liability Program's new E&O program risk manager, Chris Boggs. He asked the same week we were reconciling the claims data for Big “I” Reinsurance Company, PCC. Chris and I were discussing E&O risk management as he was charting a course for the loss prevention efforts of the national E&O program.
It was one of those “aha” moments. In my 20 years at the Big “I,” I realized we'd never looked at that. I also realized we have the data to answer that question.
For those of you that are not aware, your national association and 43 Big “I” state associations came together over 10 years ago to form the Big “I” Reinsurance Company. It is designed to provide an alignment of interests with our underwriter. This supports your association's role in assuring the long-run stability of the national E&O program.
The data comes from the Big “I” Reinsurance Company’s "seat at the underwriting table." It absorbs a share of each loss paid out in the program and, by paying a share of those losses, the association gets a firsthand view into trends in the program. We gain insights by examining those claims for trends in causes, such as regional differences.
Below is a graph of the claims over $100,000 in paid losses charted by the loss date:

Source: Big “I” Reinsurance Monthly bordereau data from 2013 to 2019 from Swiss Re underwriting insurers. Actual claim counts are hidden, as that data is proprietary, but the proportionality of claims frequency are those actually experienced in the Big “I” Professional Liability Program.
There was no significant difference in data for all claims, so I used claims resulting in payments greater than $100,000.
The loss date is the day when the error allegedly occurred that caused the claim. The data covers the years the Big “I” Reinsurance Company has taken its reinsurance position on the program, which is seven at the end of 2019.
I see no significant identifiable trends. One might argue more claims occur on Wednesday than other days of the week, but it does not appear conclusive to me. It might just be that more businesses are transacting more business on Wednesday.
On trends by season, month or year, the trendline added to the "Day of Year" graph indicates some potential seasonality in spring and fall but, as you can see, it's also inconclusive. That conclusion is affirmed by looking at a 30-day moving average as that eliminates any influence of monthly groupings.
What's the lesson?
As students of the industry and independent agents, you need to know that everyday matters in E&O risk management.
There is no day of the week nor time of year you can relax your E&O loss prevention efforts. That’s why the program's E&O loss prevention and risk management resources are available continuously at E&O Happens, where you’ll find checklists, sample disclaimers, information on self-audits and more.
Everyday vigilance is why all the resources are listed online. For in-person education, go to your Big “I” state association for information on the successful E&O Loss Control Seminar.
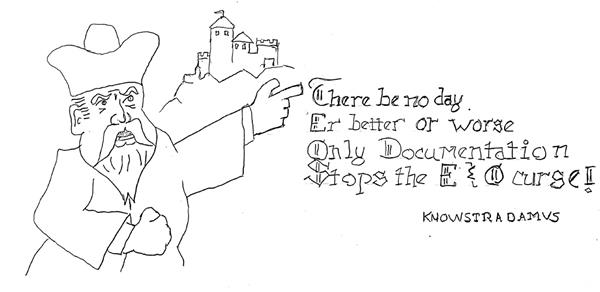
I recently read that Nostradamus had predicted the coronavirus pandemic. Of course, every major event usually turns out to have been predicted, however imprecisely, by the famous 16th century astrologer. No disrespect nor credibility is given to Nostradamus’ predictions, but if below sketch helps you remember the most important tenant of agency E&O risk management, all the better.

This Student of the Industry article is part of a new monthly column exclusively on IA Magazine. Keep an eye on Thursday’s weekly News & Views e-newsletter in April for the next off-beat take on current trends in the insurance industry.
Paul Buse is operations and strategic advisor, Big I Advantage®.
