You might think the Super Bowl is about football, but for many, it's the ultimate game day for television advertising. As we head into that time of year, how does property-casualty insurance fit into the total advertising picture?
As an industry, P-C insurers spend a lot on advertising. So, how does insurance advertising spending stack up against all national advertising spending? And, does all that spending even make sense?
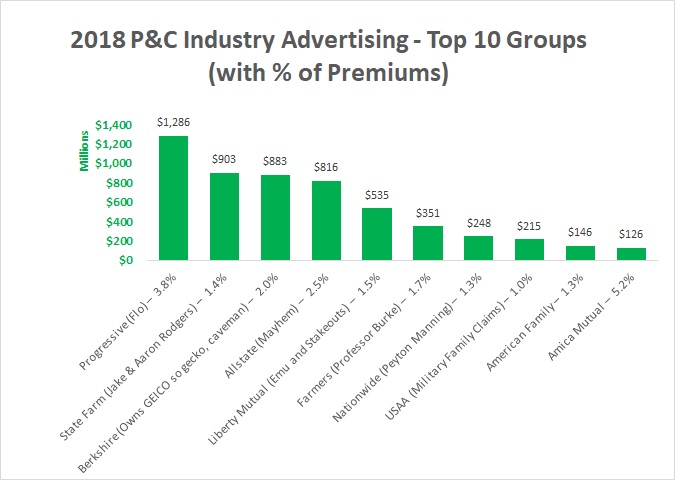
Below is the top 10 p-c insurer groups’ advertising spend in 2018. The total, $6.7 billion, is about 2.7% of all U.S. advertising spending, which is $240 billion.
Overall, the advertising spend equates to about $20 per person in the U.S. or about $60 for the typical insurance-purchasing single person, couple or family. After watching the football games last weekend, 2.7% is not as high as I expected that’s for sure.

Note: The total for all insurers is $6.7 Billion and the top 10 are 82% of total. The average cost of advertising for the whole industry is about 1% for all premiums and about 2% for personal lines premiums. The percentage added to the label for each insurer group is the group’s ratio of advertising to the group’s total premiums.
The top three spenders are no surprise to me. Flo, Jake and Aaron Rodgers, and the GEICO Gecko all are so familiar that I think everyone has seen their advertisements. On the other hand, Farmers’ rank outside the top five surprised me as Professor Burke (J.K. Simmons) is so recognizable to me. But maybe it’s because Burke sticks in my mind favorably as his focus is on coverage and not just price.
I will add, although it's tough for me—a Green Bay fan—to see Aaron Rodgers and know that he isn't exactly on the independent agent's side, it’s refreshing that he does highlight the importance of his human agent advising him in his purchasing decisions. But let's turn an eye toward independent agency companies. These are the insurers that are listed by A.M. Best in their database as "Marketing Type: Independent Agency."
| Insurer Group or Unaffiliated Company | Advertising Spending | Direct Premiums Written IA Companies (Cos) Only | % of DPW |
| Progressive IA Cos Only | 183,431,000 | 15,465,522,000 | 1.2% |
| Liberty Mutual IA Cos Only | 182,051,000 | 4,230,497,000 | 4.3% |
| Travelers IA Cos Only | 70,567,000 | 24,862,096,000 | 0.3% |
| National General IA Cos Only | 61,262,000 | 1,834,523,000 | 3.3% |
| Hartford IA Cos Only | 57,406,000 | 11,554,777,000 | 0.5% |
| Mercury General IA Cos Only | 35,320,000 | 3,143,501,000 | 1.1% |
| Chubb IA Cos Only | 26,938,000 | 13,504,722,000 | 0.2% |
| Erie IA Cos Only | 26,292,000 | 6,644,604,000 | 0.4% |
| Root Insurance Company | 23,202,000 | 106,372,000 | 21.8% |
| Zurich IA Cos Only | 22,398,000 | 5,969,100,000 | 0.4% |
Note: Premiums included are only those for independent agency marketing-type insurers in the group.
In the above, there was a surprise for me: Root Insurance Company. I did some research and I believe the label as “Marketing Type: Independent Agent” is likely due to their ownership of an insurance agency subsidiary. They are probably not "independent," at least not in a traditional sense. I checked their insurer appointments in their largest state, Texas. They show no appointments.
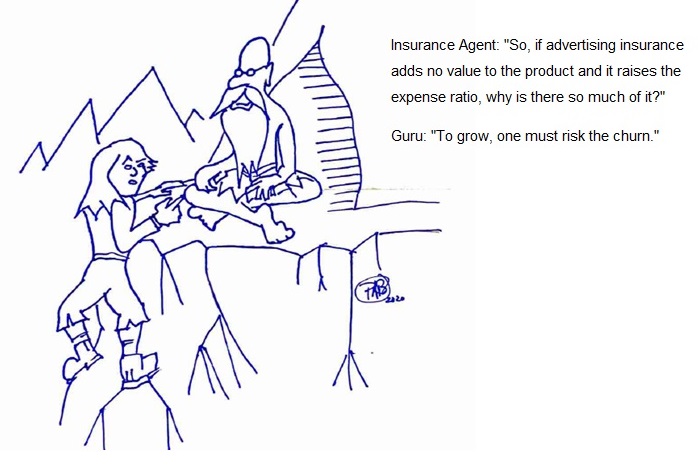
Why does our industry spend billions each year on advertising, and does it make sense?
The textbook reason to advertise is "to make a prospective buyer aware of a product and therefore more likely to buy it." That’s certainly true, but as students of the industry, you should also be aware that advertising might just motivate more frequent shopping based solely on price.
If that is the case, advertising might result in not just a standalone cost added to the premium dollar, but also the increased costs associated with managing more new business instead of renewal business. Of course, as is often the problem with evaluating the effectiveness of advertising spending, the answers are not known for certain.
You should be aware that not all “advertising” captured in insurer annual filings is for TV, and you probably see evidence of that in your agency as insurers increase their emphasis on other promotions, such as digital expenditures.
Stay tuned for the next monthly Student of Industry column in February. Have a thought? Email me about anything you are curious about and might benefit from someone looking into it.
Until then, if you know anyone at Safeco, tell them to send me $40 worth of the best beers in Washington state and I won't consider increasing the industry's expense ratio by shopping my policies!

This Student of the Industry article is part of a new monthly column exclusively on IA Magazine. Keep an eye on Thursday’s weekly News & Views e-newsletter in February for the next off-beat take on current trends in the insurance industry.
Paul Buse is operations and strategic advisor, Big I Advantage®.
Data by BestLink Advantage 2.0, A.M. Best Company, Inc. “Statement Pages, Part 3-Expenses, Underwriting and Expense Exhibit.”
