Pivoting to Life, Health and Benefits: Is It Worth It?

By: Paul Buse
The feature story in the June edition of Independent Agent magazine about cross-selling from property-casualty into life-health, as well as Big “I” chairman Jon Jensen’s column, reminded me of playing lunchtime hoops against David Hulcher, Kansas Association of Insurance Agents state executive, when we were both at the Big “I” national.
On a good percentage of Hulcher’s drives, he would pivot to his left. That unexpected move often resulted in me defending empty space as he went by.
In this ever more competitive property-casualty world, it seems like pivoting to life, health and benefits is just like being able to go to your left in basketball. But as a student of the industry, can we measure the upside? And can we get the premiums and commission rates that will make a pivot worth it?
Readers of this column will know that p-c insurance figures are straightforward. Virtually all p-c insurers file the same annual filings and we can turn to that data to make assumptions.
But is that possible with insurers in the life and benefits space? The answer is yes, but it involves some finesse due to some challenges with interpreting the datasets available.
First, there are two industry classifications of insurers to consider when pivoting to life and benefits. These are life, accident & health and annuities insurers (LAHA) and other insurers classified as health insurers. Second, while free and detailed industry summaries exist for p-c and LAHA, the same detail is not readily available for health insurers.
However, the National Association of Insurance Commissioners (NAIC) compiles summaries of all types of insurance. Their summaries for p-c, LAHA and health all have premium data. Using data from all three summaries, below is a chart of premiums grouped by product area. Some types of coverage—mostly accident and health—are written by all three types of insurers. Fortunately, the NAIC looks at that issue and provides data on it. All the other non-p-c premiums are based on clear delineation in NAIC annual reports.
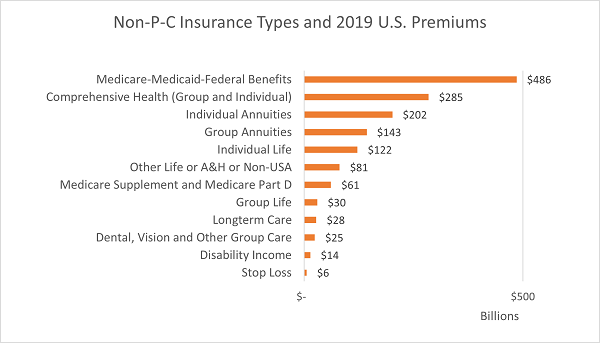
Source: National Association of Insurance Commissioners and U.S. Health Insurance Industry and 2019 Annual Results and National Association of Insurance Commissioners (statistical compilation of annual statement information for life and fraternal companies in 2019).
The chart above shows that the premium potential in non-p-c lines is significant, about $1.5 billion in total, which is around twice the size of the p-c marketplace. Of course, some lines of business are offered through specialists. Generally, independent agents are not involved in government programs in Medicare, Medicaid and Federal Employees Health Benefits. Still, even after removing those programs from the target market, what remains is at least as big as the p-c market and the pivot seems well worth it.
But what about commission rates? We know commissions vary in p-c from product to product, even between insurers for the same product. That exists in non-p-c as well, which also are often characterized by higher first-year commissions and lower—or no—renewal commissions.
The best way to compare p-c commissions with LAHA and health commission is by using the annual reported and audited average commissions. If different commissions are paid on new business, presumably that is reflected in the reported average numbers. That is, if a p-c product pays 10% commission on new and renewal business, the average will be 10%, the same as the commission every year.
On the other hand, let’s use an example of a life policy paying 75% new and 1% renewal commission. Keeping that in mind if the average span of a life policy is eight years, that means that 75% commission plus seven years at 1% commission is an average of about 10% per year.
Below are commissions for products sold by LAHA and p-c insurers. The NAIC provides an aggregate annual report for these insurers for all figures, including commissions. The NAIC summary for life insurers does not include all commission figures, which limits the commission presentation below to the coverages in LAHA and p-c insurers. That is, health insurers are not included.
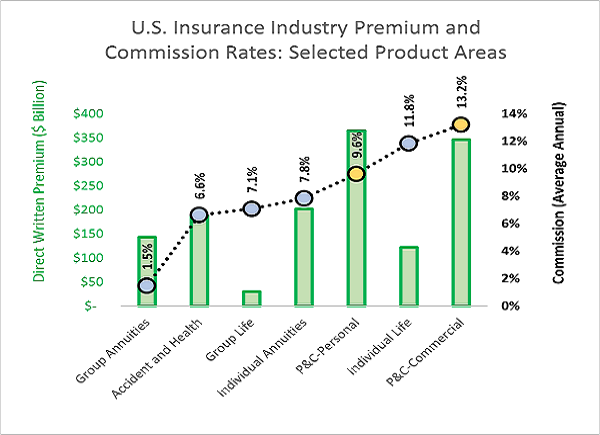
Source: 2020 National Association of Insurance Commissioners (statistical compilation of annual statement information for p-c insurance and life and fraternal companies in 2019).
In the above chart, p-c premiums and commissions have been apportioned into the major divisions of personal and commercial lines, which is possible since the full data set for p-c insurers is readily available. The dotted link compares the lowest average commission on the left moving to the highest on the right. P-c is highlighted by orange markers and life, accident & health and annuities in blue.
As students of the industry, you can now better assess the upside of a pivot to life and benefits. And given the different nature of upfront compensation versus recurring, it can be very helpful to newer agencies that are managing their cash flow.
While you can’t perfectly measure every life and benefit line, if you don’t try and put the time in to be proficient, you will never know how successful it will be—just like going to your left in basketball.

Paul Buse is principal, founder and owner of Real Insurance Solutions Consulting.
This Student of the Industry article is part of a monthly column on IAMagazine.com. Keep an eye on Thursday’s weekly News & Views e-newsletter in August for the next off-beat take on current trends in the insurance industry.
